
The first light that we observed was white light. When the light is first observed a string of rainbow colors are instantly visible. The closest color to the bulb was blue while the furthest color from the bulb was red. The colors appeared in the order of violet, blue, green, yellow, red.


The distance from the light source (D) was measured and is listed below.
Violet 19.9+ 0.2 cm, Blue 22.3 + 0.2cm, Green 25.1 + 0.2 cm Yellow 26.9 + 0.2 cm, Red 41.0 + 0.2cm.
The diffraction grating (d) was 500 lines per mm. The distance to the slit (L) was 1m + .01 m, with this data the corresponding wavelengths can be determined.
λ = (D*d)/sqrt(L^2 + D^2)
λ_ Violet = 390nm + 9nm, λ_Blue = 435nm + 9nm, λ_Green = 487nm + 9nm, λ_Yellow = 520nm + 9nm, λ_Red = 759nm + 9nm,
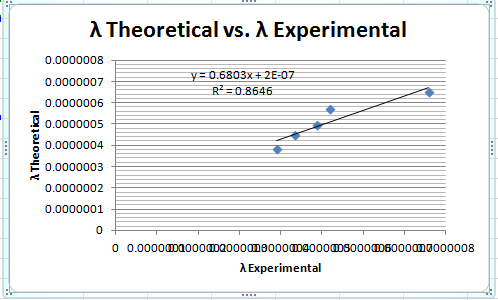
In order to get an accurate result, we mapped our measured values to a graph of actual values to see how our values compare to the actual result. We used this formula, λ = mλ' + λ_0. λ is our adjusted wavelength compared to the actual scale. In this formula λ' is our experimental λ and λ_0 is a constant that will correct the experimental λ to the scale of the actual λ. The slope was obtained by comparing values from the actual λ and the experimental λ. The constant λ_0 can be found from the equation, λ - λ _1 = m(λ'-λ_1'), λ_1 prime is an actual value while λ_1' is an experimental value. After some algebra, the equation results to λ = mλ' - mλ_1'+ λ_1, the quantity (-mλ_1' + λ_1) = λ_0.
λ mapped: λ_Violet = 466nm + 44nm, λ_Blue = 496nm + 44nm, λ_Green = 531nm + 44nm, λ_Yellow = 553nm + 44nm, λ_Red =716nm + 44nm.
In the next part of the experiment we observed the light from hydrogen gas. Only four different colors were observed from the spectra.

Violet = 22.1 + 0.2cm Blue = 25.2 + 0.2cm Yellow = 30.8 + 0.2cm Red = 35.0 + 0.2cm

The calculated λs from this were:
λ_Violet = 431nm + 24nm, λ_Blue = 489nm + 24nm, λ_Yellow = 589nm + 24nm, λ_Red = 661nm + 24nm.

λ_Violet = 391 nm + 42nm, λ_Blue = 435 nm + 42nm, λ_Yellow = 512 nm + 42nm, λ_Red = 567nm + 42nm.
Lastly, we observed the line spectra for an unknown gas and had to determine which gas it was.


The observed values (D) from the light source were:
Violet = 20.1 + 0.2cm Blue = 22.7 + 0.2cm Green = 26.1 + 0.2cm Yellow = 29.9 + 0.2cm Red = 35.8 + 0.2cm

λ_Violet = 392 nm + 8 nm λ_Blue = 439 nm + 8 nm λ_Green = 498 nm + 8 nm λ_Yellow = 562 nm + 8 nm λ_Red = 658 nm + 8 nm. From the following data we can determine that our unknown gas was helium.

In this lab we were able to determine the spectral lines when we looked at light, or gases through a diffraction grating. The distance of the different colors observed we were able to map it to the actual values to determine how accurate we were.
No comments:
Post a Comment